

How Loss Tracker Reduces Waste of Motion in the Production Line
In production lines, many organizations focus on Downtime or machine breakdowns. However, they often overlook the “micro-movements” of employees that repeat throughout the day. Whether it is walking to retrieve tools, bending to search for parts, or brief pauses between production cycles, these inefficiencies constitute Waste of Motion. Although these losses seem minor, their accumulation can significantly impact Productivity and OEE. The critical question is: how can we visualize and manage these hidden losses?
You May Also Like


This is where the Loss Tracker plays its role—a tool that transforms the mere “feeling that work is slow” into “measurable, analyzable, and improvable data”. Through automated data collection and real-time display, it helps organizations identify true loss points, reduce unnecessary movement, and systematically elevate production line efficiency for long-term sustainability. But first, Solwer will introduce you to what Waste of Motion actually is.
What is Waste of Motion?
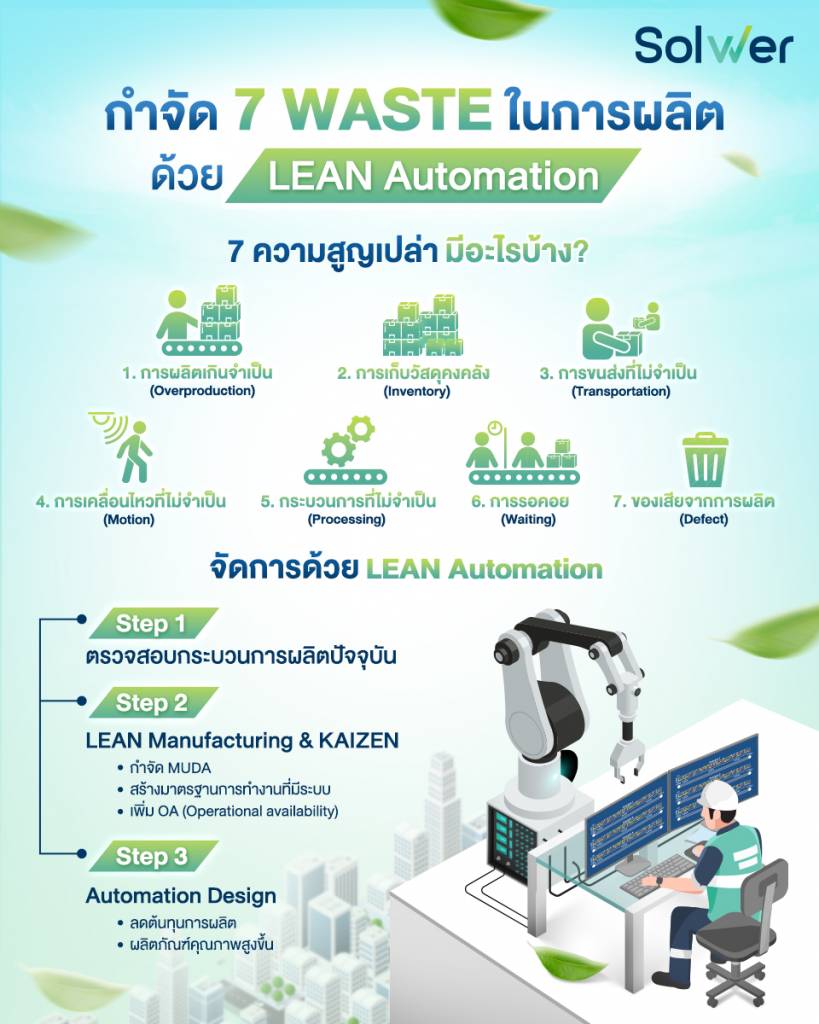
According to MUDA (Lean’s 7 Wastes), Waste of Motion refers to unnecessary “human movement” that does not add value to the product. This includes activities such as walking, bending, reaching, turning, searching, or repetitive grasping—actions for which customers are unwilling to pay. The MUDA concept originated from the Toyota Motor Corporation production system under Taiichi Ohno, who identified Motion as one of the seven primary wastes.
Key Differences: Motion vs. Transportation (Based on Lean & MUDA)
The concept of MUDA, developed by Taiichi Ohno at Toyota, defines “waste” as any resource-consuming activity that fails to create value from the customer’s perspective. While Motion and Transportation are often confused, they represent distinct systemic issues:
1. Motion: Unnecessary Movement of "People"
Motion refers to physical employee movements that add no value to the product, such as repetitive walking, reaching, or searching. According to The Toyota Way, Waste of Motion often stems from:
- Inappropriate workspace design.
- A lack of Standardized Work.
- Tool placement that does not align with the process sequence.
In-depth Impacts of Waste of Motion:
- Directly reduces productivity.
- Increases employee fatigue.
- Elevates the risk of ergonomic injuries.
- Causes fluctuations in Cycle Time.
- Indirectly impacts the Performance component of OEE.
Motion is a waste directly related to “Human System Design”.
2. Transportation: Unnecessary Movement of "Materials/Products"
Transportation is the movement of raw materials, work-in-process (WIP), or finished goods that does not add value, such as multiple trips or storing items far from their point of use. According to the Lean Enterprise Institute, Transportation waste:
- Increases logistics costs.
- Increases the risk of product damage.
- Extends Lead Time.
- Increases Work-in-Process (WIP).
Transportation is more closely related to the “Flow Design” of the production system.
Systemic Comparison
| Feature | Motion | Transportation |
|---|---|---|
| Involves | People | Materials/Products |
| Primary Causes | Poor layout, lack of 5S, unclear SOPs | Improper factory layout, non-continuous flow |
| Impacts | Fatigue, Ergonomic Risk, Performance Loss | Increased Lead Time, high moving costs |
| Improvement Dimension | Ergonomics + Standard Work | Layout + Value Stream Flow |
While both Motion and Transportation add no value, Motion focuses specifically on “human behavior and task design”.
Examples of Waste of Motion in Factories
- Walking to fetch tools stored too far away (reflects a lack of Point of Use Storage).
- Bending to search for parts in unorganized boxes (reflects a lack of 5S and Visual Control).
- Frequently reaching for items above head height (risks ergonomic injury).
- Turning back and forth between workstations (reflects a layout that does not align with work flow).
- Clicking through multiple steps in poorly designed software (Digital Motion Waste).
Why Waste of Motion is a "Silent Danger"
Ergonomics research shows that micro-motions repeated hundreds of times a day increase the risk of Cumulative Trauma Disorder and reduce long-term labor efficiency. Although a single unnecessary movement might take only 3–5 seconds, occurring 500 times daily results in 25–40 minutes of lost time per person every day. When multiplied across all employees, this represents a significant labor cost that often remains invisible in summary reports.

Systematic Approaches to Reducing Waste of Motion
Waste of Motion refers to unnecessary “human movement” that does not add value, such as walking, bending, reaching, or searching. While individual instances seem minor, they accumulate into significant labor costs, lost time, and health risks. Reducing this waste requires simultaneous optimization of the workspace, workflow systems, and behavior.
1. 5S Workplace Organization
5S is a spatial management system designed to eliminate unnecessary movement.
Practice Guidelines:
- Sort: Separate necessary from unnecessary items to reduce time spent searching.
- Set in Order: Arrange equipment according to the sequence of use.
- Shine: Clean the area to simplify inspections and searching.
- Standardize: Define fixed locations using boundary lines or labels.
- Sustain: Perform regular monitoring to maintain habits.
Key Concept - Point of Use
Frequently used tools must be within arm’s reach to eliminate walking, bending, or searching.
Expected Results:
- Reduction in search time by 20–50%.
- Decreased repetitive walking.
- Reduced long-term fatigue.
Solwer Solution
Replaces paper with Digital Checklists, records Before–After photos, and creates Real-Time Dashboards to transform 5S into a measurable system.
2. Layout Optimization
The root cause of motion waste is often a poorly designed workflow layout.
- Core Concepts: Design for continuous One-piece flow when possible, minimize distances between stations, and place raw materials near their point of use.
- Analysis Methods: Utilize Spaghetti Diagrams to track actual walking paths, measure total distance per shift, and calculate cumulative lost time.
- Solwer Solution: Uses Real-Time Cycle Time data to analyze bottlenecks that force extra walking. A Production Dashboard compares performance before and after layout changes to ensure decisions are data-driven rather than based on intuition.
- Result Example: Reducing walking by 15 meters per cycle in a 300-cycle daily production run saves 4,500 meters of walking per person per day, increasing productivity without adding staff.
3. Standard Operating Procedures (SOP)
Unclear SOPs cause workers to improvise, repeat tasks, or perform unnecessary rework.
- Guidelines: Define the shortest sequence of steps, use Visual Work Instructions, set Standard Cycle Times, and eliminate unnecessary micro-motions. Effective SOPs reduce variance and ensure consistency across all shifts.
Solwer Solution: Converts SOPs into Digital Work Instructions on screens, reducing the need to walk to physical document stations and allowing for centralized standard updates.
4. Ergonomic Design
Waste of Motion is frequently linked to designs that do not accommodate human physiology.
- Recommended Improvements: Ensure proper workbench height, minimize bending beyond 20 degrees, place equipment in the Power Zone (shoulder-to-waist height), and use ergonomic chairs.
- Positive Impacts: Reduces Cumulative Trauma injuries and sick leave while increasing work continuity. Ergonomics is a long-term efficiency strategy.
- Solwer Solution: Analyzes productivity data to identify areas where workers are abnormally slow, linking performance data to specific workstations to pinpoint high-risk ergonomic areas.
5. Motion Economy
Motion Economy aims to achieve the same output with the least amount of movement possible.
- Examples: Replacing manual strapping with assistive devices, using sequenced trays instead of picking individual parts, and adjusting positions to be in front of the worker rather than requiring turning.
- Impact: Saving just 1–2 seconds per micro-motion over 500 daily repetitions saves more than 15 minutes per person per day.
- Solwer Solution: Analyzes time per step and uses Run Charts to track improvements, providing clear Before–After measurements of production capacity increases.
6. Digital and Automation Systems
In the Lean Digital era, motion waste also occurs within digital workflows.
- Digital Motion Waste Examples: Excessive clicks in software, redundant data entry, or walking to physical boards to check reports.
- Solutions: Implement Real-Time Dashboards, minimize UI clicks, use Workflow Automation, and eliminate paper documentation.
- Solwer Solution: Production & Digital Workflow solutions consolidate on-site data in real-time, eliminate redundant data entry, and display production results instantly, removing the need for manual floor inspections.
Furthermore, Loss Tracker technology helps factories visualize previously “unseen” losses—such as cycle times exceeding standards or repetitive micro-stoppages—through real-time data. By systematically recording and analyzing every movement, organizations can identify specific areas for improvement, eliminate unnecessary motions, and sustainably increase production line efficiency

What is Loss Tracker?
Loss Tracker is a digital system designed to record, analyze, and track “Losses” occurring in the production process in real-time. It connects data from machinery—such as PLC or sensors—with on-site event recording to categorize losses into specific types, including Downtime, Speed Loss, Quality Loss, Micro-stoppages, and excessive Motion.
A prominent example in the market is the D-QiTs IoT Loss Tracker by DENSO, which visualizes production and loss data on a real-time Dashboard. This tool enables teams to clearly identify loss causes and obtain measurable results.
How Does Loss Tracker Work?
The Loss Tracker functions as more than just a data collection system; it serves as a tool that transforms on-site data into insights for systematic production efficiency improvements through the following steps:
1. Automatic Data Collection
The system connects to machinery via IoT, PLC, or various sensors to pull critical real-time data:
- Cycle Time compared to Standard Time.
- Output/Actual Production compared to the production plan.
- Machine Status (Run, Stop, Idle, Setup).
- Downtime Events with precise, second-level timestamps.
Automated collection reduces errors associated with manual logs and reveals “Micro-losses” or short stops that might otherwise go unrecorded. This results in an accurate and continuous database for genuine OEE analysis.
2. Loss Classification
Once events are recorded, the system categorizes losses according to standard structures:
- Planned Downtime: Such as scheduled changeovers or maintenance.
- Unplanned Downtime: Such as machine breakdowns.
- Speed Loss: Running at a slower pace than the standard.
- Quality Loss: Defects or rework.
- Minor Stop / Micro-stoppage: Frequent short interruptions.
This classification enables clear Pareto Analysis to determine which losses impact OEE most significantly, replacing intuition with data-driven decision-making.
3. Real-Time Display (Dashboard & Alerts)
All information is presented on an easy-to-understand Dashboard:
- OEE Trends: Viewed hourly or daily.
- Pareto Charts: Visualizing the causes of machine stoppages.
- Comparisons: Analyzing performance between different lines, shifts, or operators.
- Heatmaps: Identifying locations where losses occur most frequently.
The system can also set Alerts/Notifications when events exceed specific thresholds, such as cycle times being higher than standard or output falling below targets. This allows line managers to engage in real-time problem-solving rather than waiting for end-of-day reports.
4. Data-Driven Kaizen (Analysis for Improvement)
The core value of a Loss Tracker is using data for actual improvement rather than just observation:
- Identify: Use Pareto charts to find the top three losses with the most impact.
- Analyze: Perform root cause analysis using methods like “5 Whys” or “Fishbone” diagrams.
- Action: Implement improvements via Kaizen, layout changes, SOP updates, or automation.
- Measure: Conduct Before-After measurements using real system data.
This process provides clear, transparent, and continuous improvement (Kaizen) by measuring numerical results, such as minutes of downtime reduced per day or the percentage increase in OEE.
Reducing Waste of Motion with Loss Tracker (IoT for Lean Production)
Effectively reducing Waste of Motion (unnecessary movements) in modern factories requires continuous, real-time data from the actual workspace rather than traditional visual observation or manual logging. Small movements, even those lasting only a few seconds, can accumulate over hundreds of repetitions per shift into significant labor costs and lost time.
The Loss Tracker system, developed by DENSO as part of the D-QiTs IoT application suite, enables factories to clearly visualize and measure Waste of Motion. By using data from sensors and IoT systems connected to production line machinery, it provides deep analysis on real-time dashboards.
Why Loss Tracker is Ideal for Reducing Waste of Motion
- Visualizing Unnecessary Movements: It connects to sensors and PLCs to display real-time performance data such as output, cycle time, and abnormal events during each production cycle.
- Capturing Detailed Time Loss: Beyond major machine downtime, the system can identify abnormally long processes or work cycles with excessive motion—such as walking to fetch tools/materials, poor material placement, or waiting for system responses. These are extracted as specific “Loss Events”.
- Integrating with Lean/Kaizen: Loss Tracker links directly to the Kaizen cycle, allowing experts to analyze primary losses and offer immediate data-driven solutions.
How to Use Loss Tracker to Reduce Waste of Motion
- Real-Time Motion and Cycle Time Collection: The system pulls the time used in each production cycle and presents it on a dashboard. This highlights which steps exceed standards, cycles with high variance, and repetitive human or machine movements that indicate Waste of Motion.
- Root Cause Analysis with Video and Support Data: Loss Tracker can record video or events during abnormalities, helping confirm the cause of Waste of Motion, reducing misinterpretation, and serving as a communication tool between management and operators.
- Systematic Loss Categorization and Prioritization: The system generates Pareto Charts and major loss reports. This allows teams to separate Waste of Motion from other losses, view trends over time, and prioritize Kaizen tasks for the highest impact.
- Linking with Lean and Kaizen Approaches: Detailed loss data enables experts to set Waste of Motion reduction as a KPI, design targeted solutions, and track cycle time improvements after implementation.
Benefits of Reducing Waste of Motion with Loss Tracker
Using Loss Tracker correctly provides both operational and strategic advantages:
- Accurate Identification of Invisible Waste: It transforms “silent losses”—such as short pauses to arrange workpieces, repetitive reaching, or walking to distant tools—into quantifiable data. It highlights indirect impacts like fluctuating cycle times or recurring minor stops.
- Significantly Reduced Analysis Time: Unlike traditional systems that require manual logging and lengthy meetings, Loss Tracker records data automatically with timestamps. One-click comparisons between shifts, lines, or operators allow for rapid decision-making.
- Increased Productivity and Work Flow: Reducing Waste of Motion leads to more stable cycle times and smoother work flow. This results in higher output per hour without increasing staff or shifts, while also reducing employee fatigue and injury risks.
- Sustainable OEE Improvement and Cost Reduction: By addressing performance losses and recurring minor stops, organizations can save hours of lost time per month and increase capacity utilization. This provides structural cost reduction without requiring additional machinery investment.
- Data-Driven Kaizen Support: Loss Tracker completes the Kaizen cycle by clearly identifying problems, allowing for experimental improvements (like layout or SOP changes), and measuring the results in OEE percentages or time saved.
Ultimately, Loss Tracker transforms the “feeling of slowness” into actionable data. It moves organizations toward truly data-driven production management and sustainable competitive advantage.
Contact Solwer for a consultation on a Loss Tracker solution suitable for your business, or get started immediately by downloading our free template to begin visualizing losses in your organization!

into Productivity
industrial experts.