

A Deep Dive into the 3 Core Pillars of OEE: A Formula to Increase Profit from Equipment Effectiveness
In an era where manufacturing facilities face rising costs, fierce competition, and unprecedented expectations for efficiency, managing equipment to achieve “maximum value and optimal results” is no longer an option; it is a necessity. One of the essential tools leveraged by leading organizations is OEE (Overall Equipment Effectiveness). It helps unlock hidden capacity within production processes and highlights the manufacturing losses that many plants might overlook.
You May Also Like


In this article, Solwer will take you on a deep dive into the concept of OEE from why measuring it holds strategic importance to explaining its 3 core components and their practical applications on the factory floor. This guide aims to help you reduce costs, boost productivity, and drive sustainable continuous improvement. If you are looking for ways to transform shop floor data into precise, data-driven decisions that generate profit, this article will lay a solid foundation and systematically build your understanding.
What is OEE?
OEE (Overall Equipment Effectiveness) is the “overall effectiveness metric” used to measure how closely a machine or production line operates relative to its maximum potential under actual production conditions. OEE considers not only “how many units are produced,” but combines 3 key dimensions—Availability (run time), Performance (production speed), and Quality (output quality)—to provide a clear view of the losses hidden in the process.
What Does OEE Measure?
OEE answers these fundamental operational questions:
- Availability: What percentage of planned production time is the equipment actually running and ready?
- Performance: When running, how close is it operating to its maximum designed speed?
- Quality: What percentage of the produced units meet quality standards without defects?
Simply put, OEE is a comprehensive score that reflects how much “true value” your equipment is generating, compared to an ideal state of “Perfect Production” where the machine operates with:
- Zero downtime (No unplanned stops)
- Maximum designed speed (No slow cycles)
- Zero defects (100% good parts)
The 3 Core Components and OEE Calculation Formula
Before diving into the OEE calculation formula and the specific details of its 3 core components, it is crucial to understand that OEE is not just another KPI metric. Rather, it is a conceptual framework that systematically helps factories visualize the “actual manufacturing losses” occurring within their production processes. OEE acts as a bridge connecting shop floor data, equipment performance, and business outcomes. This enables management and operational teams to clearly pinpoint exactly where production time was lost, why equipment speed decreased, and where defects originated.
The heart of OEE lies in analyzing 3 core components that reflect the most fundamental challenges of any manufacturing plant: Availability, Performance, and Quality. By understanding these three pillars and calculating them together into an OEE score, factories can uncover the hidden capacity of their existing equipment and plan targeted improvements, moving away from guesswork-based problem-solving.
Take Your Production Further: If you want to study OEE in greater depth—from core concepts, data collection methods, and metric interpretation to practical factory floor implementation, we highly recommend downloading the Solwer e-book. Packed with actionable insights and real-world shop floor examples, it is designed specifically for executives, engineers, and process improvement teams aiming to elevate manufacturing efficiency sustainably.

into Productivity
industrial experts.
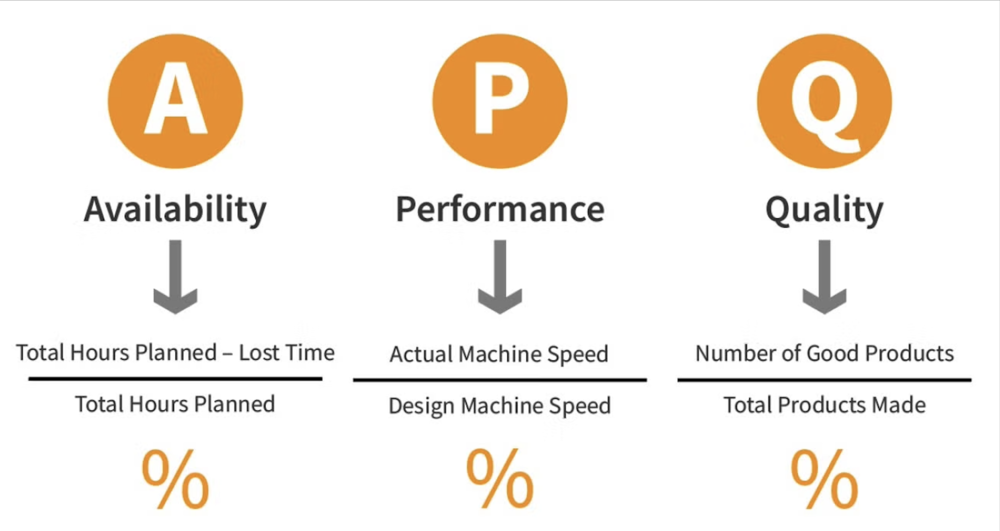
1. Availability
Availability measures the percentage of the “Planned Production Time” the equipment was actually operating.
- Core Concept: Even if a machine runs at lightning speed and produces perfect quality, if it stops frequently, the total output will still be low.
- General Formula: Availability = Operating Time ÷ Planned Production Time
- Planned Production Time: Scheduled production time (e.g., total shift time minus planned breaks).
- Operating Time: The actual time the machine is running (Planned Production Time minus any downtime for breakdowns, setups, or waiting).
Examples of Losses that Reduce Availability (Downtime Losses):
- Equipment Failure / Breakdowns
- Prolonged Setups and Adjustments (Changeovers)
- Waiting time (e.g., waiting for raw materials, maintenance technicians, approvals, or QC inspections)
- Utility-related stoppages (e.g., power dips, insufficient compressed air)
Ultimately, Availability reflects the clear, visible “lost time” caused by equipment stoppages.
2. Performance (Production Speed)
Performance measures how fast the equipment is producing compared to its maximum standard speed “while it is actually running.”
- Core Concept: A machine might not experience major breakdowns, but if it runs slower than it should or suffers from frequent minor stoppages, it will still fail to meet production targets.
- General Formula: Performance = (Ideal Cycle Time × Total Count) ÷ Operating Time
- Ideal Cycle Time: The standard time required to produce one unit (the theoretical maximum speed or designed speed).
- Total Count: The total number of units produced (including defective parts).
- Operating Time: The actual time the machine is running.
Examples of Losses that Reduce Performance (Speed Losses):
- Reduced Speed: Operating the equipment at a slower pace than the standard or designed speed.
- Idling and Minor Stops: Brief interruptions (e.g., sensor trips, material jams, or parts getting stuck requiring frequent manual resets).
- Inconsistent Feeding: Irregular supply of raw materials or parts, causing the machine to run sporadically.
- Suboptimal Parameter Settings: Forcing operators to deliberately slow down the machine to maintain acceptable product quality.
Ultimately, performance reflects the “lost speed” and the accumulation of “minor interruptions” that silently add up to a massive loss in overall output.
3. Quality
Quality measures the percentage of the “produced units” that are good parts that meet quality standards.
- Core Concept: Producing in high volumes or at high speeds is meaningless if defect rates are high. This increases costs and wastes valuable production time on products that cannot be sold.
- General Formula: Quality = Good Count ÷ Total Count
- Good Count: The number of good parts meeting specifications.
- Total Count: The total number of units produced (including defects and rework).
Examples of Losses that Reduce Quality (Quality Losses):
- Process Defects (scrapped parts during production).
- Rework (parts requiring reprocessing to become acceptable).
- Startup Losses / Reduced Yield (defects generated during machine warm-up or after changeovers).
- Issues stemming from raw materials, tooling, equipment condition, or unstable process control.
Ultimately, Quality reflects the “lost units” resulting from production that failed to meet standard specifications.
The OEE Formula
OEE = Availability × Performance × Quality
Why Multiply These 3 Components Together?
OEE uses multiplication to reflect a fundamental manufacturing reality: if any single factor underperforms, the overall effectiveness drops immediately.
- Low Availability: The equipment is rarely running.
- Low Performance: The equipment is running, but not at full speed, or it is experiencing frequent minor stops.
- Low Quality: The equipment is producing, but the output cannot be sold.
Therefore, the formula OEE = Availability × Performance × Quality provides a comprehensive overview that lets factories know exactly “where the losses are” and what needs to be prioritized for improvement. This allows management to take a systematic approach to increasing production capacity, driving down costs, and minimizing waste.

Why Measure OEE? The Strategic Benefits
1. Making "Production Time Losses" Clear and Measurable
Many factories often sense that they are “falling behind schedule” or that their “machinery lacks efficiency,” but they struggle to pinpoint exactly where the time is being wasted. OEE converts these vague observations into verifiable, actionable data. By categorizing the three primary types of waste—Downtime Loss, Speed Loss, and Quality Loss—OEE clearly reveals exactly where and how much of your planned production capacity is disappearing.
The primary advantage of this “clarity” is the ability to logically prioritize your problem-solving efforts. For example:
- If Availability is low, It indicates that time is heavily consumed by downtime. Your team must focus on resolving equipment breakdowns or optimizing setup and changeover times.
- If Performance is low, It signals that the machine is suffering from minor stops or failing to reach target speeds. The focus should shift to resolving bottlenecks, material feeding issues, or standardizing machine settings.
- If Quality is low, It means defects are eating into your productive capacity. The priority becomes improving processes, adjusting parameters, or tightening quality control.
Furthermore, when broken down, OEE connects directly to the “Six Big Losses,” a standard framework of manufacturing waste found in almost every facility. This provides shop floor teams with a common language, making communication easier and data collection far more systematic.
2. Serving as the Core Metric for Continuous Improvement, Lean, and TPM
OEE is much more than just a KPI used for management reports; it acts as a “compass” for continuous improvement. It clearly dictates both where you need to focus and how to measure the results after implementing changes.
- From a Lean Manufacturing Perspective: OEE helps identify the specific wastes that impact actual production time (stopping, waiting, running slow, producing defects). This guides high-impact methodologies like Kaizen, SMED (Single-Minute Exchange of Dies), and standardized work to the areas where they will deliver the greatest return on investment.
- From a TPM (Total Productive Maintenance) Perspective, OEE is the ultimate metric for evaluating the success of your maintenance strategies. Since TPM directly aims to elevate Availability, Performance, and Quality, tracking OEE proves whether your efforts are successfully reducing breakdowns, eliminating emergency stops, and stabilizing equipment.
Simply put, OEE ensures that your improvement initiatives remain laser-focused and prevents them from turning into resource-draining projects with unmeasurable results
3. Transforming Data into Insights for Strategic Decision-Making and Increased Productivity
The true strategic benefit of OEE is that it enables executives to make more “accurate” decisions regarding where to focus improvements first, where to allocate capital investments, and what the expected ROI will be.
A widely adopted framework is Information → Decision → Action: you must have precise data to pinpoint your focus areas and consistently execute your plans. Moreover, when OEE data indicates that losses are concentrated in a specific area, the team can strategically respond by:
- Targeting Bottlenecks: Allocating critical resources—such as manpower, maintenance technicians, and spare parts—directly to bottleneck machines.
- Smart Automation Investments: Investing in automation only at specific points where it yields the highest return, rather than overhauling the entire production line.
- Optimizing Schedules: Adjusting production and maintenance planning to minimize the negative impact on overall manufacturing capacity.
- Maximizing Current Assets: Aiming to unlock the hidden capacity of existing equipment before considering capital expenditures for new machinery.
Many industry experts highlight that OEE is the core driver of continuous improvement. Once you can clearly “identify and measure the losses,” you can design targeted, effective, and sustainable countermeasures.
Strategies for Improving OEE to Boost Profitability and Reduce Factory Waste
Improving your OEE score does not mean pushing your machines beyond their limits or forcing operators to work harder. Instead, it is entirely about eliminating waste—removing the obstacles that prevent your equipment from generating value at its full potential. As OEE improves, a factory can produce a higher volume of good parts using the exact same resources, which directly and positively impacts the bottom line.
A successful improvement strategy should begin by systematically evaluating all 3 core pillars of OEE
1. Increasing Availability: Minimizing Unnecessary Downtime
Availability is often where factories suffer their most significant losses, simply because the equipment is “not running” during the time it is scheduled for production.
Improvement Guidelines:
- Categorize and Analyze Downtime: Systematically analyze the root causes of downtime by category (e.g., equipment breakdowns, prolonged setups/changeovers, waiting for raw materials, or waiting for maintenance technicians).
- Prioritize Losses: Separate downtime incidents into “preventable” and “unavoidable” categories to effectively prioritize your corrective actions.
- Optimize Changeovers: Streamline setup and changeover processes by applying the SMED (Single-Minute Exchange of Dies) methodology.
- Proactive Maintenance: Transition away from reactive, emergency repairs by implementing robust Preventive Maintenance (PM) schedules.
- Empower Operators: Upskill machine operators to perform basic daily machine care, cleaning, and inspections, adhering to the principles of Autonomous Maintenance (AM).
Impact on Profitability:
- Reduces overtime (OT) and excess labor costs.
- Increases the actual productive time per shift.
- Minimizes opportunity costs associated with idle equipment.
2. Increasing Performance: Optimizing Speed and Reducing Minor Stops
Many factories encounter situations where the machines “aren’t broken, but still can’t keep up with production targets.” This scenario is typically driven by Performance Loss.
Improvement Guidelines:
- Define Clear Standards: Establish clear, accurate, and realistic Ideal Cycle Times for every product.
- Address Hidden Stops: Analyze frequently occurring but unrecorded Minor Stops. Improve material feeding, part orientation, and the overall flow of materials.
- Standardized Work: Implement Standardized Work procedures to ensure operational consistency across all shifts and operators.
- Optimize Settings: Verify and adjust machine parameters to ensure they match the optimally designed speed.
Impact on Profitability:
- Increases the number of units produced per hour without the need to invest in new equipment.
- Lowers per-unit costs by better absorbing labor and overhead expenses.
- Reduces Work-in-Process (WIP) inventory and manufacturing Lead Time.
3. Increasing Quality: Reducing Defects and Rework
Quality Loss is widely considered the “most expensive” type of waste. It consumes your production time, equipment capacity, and raw materials, only to yield products that cannot be sold.
Improvement Guidelines:
- Defect Analysis: Systematically analyze defects by type, root cause, and the specific time of occurrence.
- Built-in Quality: Establish Quality at the Source (Built-in Quality) to drastically reduce start-up defects and yield losses immediately following changeovers.
- Mistake-Proofing: Implement Poka-Yoke mechanisms to prevent human errors and process deviations.
- Stabilize Processes: Fine-tune machine parameters and maintain stable overall equipment conditions.
Impact on Profitability:
- Significantly reduces the cost of wasted raw materials and scrapped parts.
- Reclaims valuable production capacity previously lost to rework, converting it back into the production of good parts.
- Mitigates business risks related to delayed deliveries and customer claims/returns.
Why OEE is Crucial for Manufacturing Plants (Reducing Costs and Boosting Productivity)
1. OEE Uncovers the "Hidden Costs" Concealed Within Your Machinery
In reality, machines do not always experience long, catastrophic breakdowns. Instead, they often suffer from minor, accumulating losses that silently drive up operational costs, such as:
- Frequent minor stops and idling that go unrecorded.
- Operating at a reduced speed (slower than standard cycle times).
- Producing defects, scrap, and rework.
- Prolonged setup and changeover times, or waiting for raw materials, maintenance technicians, and quality approvals.
All of these factors translate directly into “lost money.” Without OEE, factories typically only see that they missed their production targets, without knowing whether the shortfall was caused by Availability, Performance, or Quality issues.
2. Enables Systematic Cost Reduction, Eliminating Guesswork
OEE dissects operational problems into 3 distinct pillars, making your cost-reduction efforts far more precise and data-driven.
Improved Availability: Reducing Costs from "Downtime"
- Reduces Overtime (OT): Production targets can be met during regular shifts.
- Minimizes Opportunity Costs: Recovers lost value from idle equipment.
- Lowers Maintenance Expenses: Reduces emergency repair costs by implementing highly targeted Preventive Maintenance (PM) and Total Productive Maintenance (TPM).
- Decreases Energy Costs: Lowers energy consumption per unit, as machines are not subjected to frequent and inefficient start-stop cycles.
Example: If you can reduce the downtime caused by lengthy changeovers, you will see an immediate drop in both labor costs and cost per unit.
Improved Performance: Reducing Costs from "Suboptimal Speeds"
- Lowers Unit Labor Costs: Produces higher volumes within the exact same timeframe.
- Improves Overhead Absorption: Fixed costs are distributed over a larger number of produced units.
- Reduces WIP and Lead Times: Work-in-Process inventory and waiting times decrease because the production line flows smoothly without interruptions.
Many factories experience the phenomenon where “machines aren’t broken, yet production is still behind schedule.” This is usually the result of accumulated Performance Loss from reduced speeds and minor stops—issues that OEE perfectly highlights
Improved Quality: Reducing Costs from Defects and Rework
- Minimizes Material Waste: Reduces raw materials lost to scrap.
- Saves Time and Resources: Eliminates the man-hours and machine capacity wasted on rework.
- Lowers COPQ: Reduces the risk of customer claims and the overall Cost of Poor Quality.
- Ensures On-Time Delivery: Eliminates the need for expediting fees and premium/rush freight costs.
Improving Quality is not just about reducing waste; it literally “reclaims” your production capacity because you no longer have to spend valuable time remaking defective parts.
3. Increasing Productivity Without Purchasing New Equipment (Maximizing Existing Capacity)
OEE allows factories to boost production capacity by eliminating losses rather than investing heavily in new machinery.
- When OEE increases, it directly means your productive time is higher, average speed is optimized, and defect rates are minimized.
- The immediate result is a tangible increase in the number of good parts produced per shift.
- This enables your facility to handle larger orders and increased demand without necessarily needing to add new production lines or schedule extra shifts.
Simply put, OEE is the key to “unearthing the hidden capacity” already present within your existing equipment.
4. Prioritizing Problem-Solving and Optimizing Investments (Lean Before Automation)
Many facilities rush into automation only to realize a poor return on investment (ROI) because underlying waste still exists within their current processes. OEE helps answer the critical question: “What is the actual core problem?”
- If the issue is Availability: Capital and effort should be invested in maintenance systems, spare parts management, changeover (SMED) optimization, and better scheduling.
- If the issue is Performance: Focus should be placed on standardized work, improving material feeding, and eliminating minor stops.
- If the issue is Quality: Efforts must target process controls, strict specification adherence, machine parameter tuning, and calibration of measurement tools.
Once the foundational waste is addressed, you can confidently consider targeted automation investments where they make the most sense. This approach guarantees a clear ROI and significantly reduces the risk of misallocating capital.
5. Getting the Factory to "Speak the Same Language" with Unified Metrics
OEE establishes a common, objective language across the Production, Engineering, Quality, and Maintenance departments.
- Every team shares the exact same visibility into whether the current bottleneck is rooted in Availability, Performance, or Quality.
- It drastically reduces cross-departmental finger-pointing because the data objectively highlights the “system gaps” and the “root causes,” rather than blaming individuals.
- It facilitates the setting of clear, actionable daily or weekly improvement targets—such as reducing downtime by 10 minutes per shift or decreasing the scrap rate by 0.5%.
6. Serving as the Foundation for Continuous Improvement (TPM, Lean, Kaizen)
OEE is not just a vanity KPI meant to look good on a dashboard; it is a strategic compass that guides actual operational improvement.
- Helps leadership select Kaizen projects that will deliver a genuine, measurable impact on bottom-line results.
- Provides a baseline to track and verify whether the implemented improvements are successfully sustaining over time.
- Transforms continuous improvement from sporadic, one-off events into a systematic, ingrained company culture.
Integrated Tools from Solwer for Sustainable OEE Improvement
Continuously and sustainably increasing OEE goes beyond simply crunching numbers; it requires robust solutions and tools to collect, analyze, and transform data into actionable insights for strategic decision-making. Solwer Solutions offers a dedicated suite of tools designed to meet these exact needs:
1. Loss Tracker: Uncovering the Root Causes of "Hidden Losses"
Loss Tracker to Solwer empowers production teams to monitor “hidden losses” that typically go unnoticed. It displays these issues in real-time as they occur directly on the shop floor, eliminating the need to wait for end-of-shift or end-of-day reports. This system helps by:
- Highlighting operational anomalies that require immediate corrective action.
- Clearly exposing the true root causes of downtime and underlying process problems.
- Fostering cross-functional communication and collaborative problem-solving to accelerate the PDCA (Plan-Do-Check-Act) cycle.
Ultimately, this system gives your team crystal-clear visibility into the specific losses impacting Availability, Performance, and Quality, ensuring your continuous improvement initiatives align perfectly with your established OEE targets.
2. Data-Driven Insights: Systematic Analysis of Production Data
Achieving sustainable OEE growth requires reliable, in-depth data to drive executive decision-making. Solwer Solutions utilizes IoT technology to accurately capture operational data from both operators and machinery. This creates a single source of truth directly from the shop floor that can be leveraged for ongoing improvements, including:
- Identifying actual operational efficiency and pinpointing true Performance Loss.
- Tracking the frequency, cadence, and patterns of recurring production stops.
- Conducting rigorous before-and-after comparisons to validate the effectiveness of implemented countermeasures.
These deep insights do more than just measure performance; they empower your engineering and production teams to scientifically design workflows and strategically plan for long-term productivity enhancements.
3. PDCA Acceleration: Speeding Up the Continuous Improvement Cycle
One of the primary goals of measuring OEE is to drive Continuous Improvement. Solwer Solutions helps accelerate the PDCA (Plan-Do-Check-Act) cycle by utilizing data from the Loss Tracker to effectively prioritize issues. This empowers your team to:
- Identify core problems first: Pinpoint the root causes that have the highest impact.
- Plan and execute immediately: Deploy targeted countermeasures without delay.
- Monitor results in real-time: Track the effectiveness of the solutions instantly.
- Continuously refine: Sustain and build upon the improvements over time.
Accelerating the PDCA cycle is not merely about making KPIs look good on paper; it is about establishing a rigorous discipline of relentlessly improving the quality and stability of your production system.
Increasing OEE sustainably is not about temporarily chasing higher numbers. Rather, it is about building a system that enables the factory to visualize actual losses, clearly understand their root causes, and drive ongoing improvements. Measuring OEE only becomes meaningful when an organization is equipped with tangible tools that connect shop floor data directly to strategic decision-making.
Solwer Solutions bridges this exact gap by transforming previously invisible losses into clear, verifiable, and actionable data. From tracking losses in real-time and providing deep data analytics to accelerating the PDCA cycle, our tools ensure that improvements happen faster and more consistently. When accurate data is used to steer Lean, TPM, and Kaizen initiatives in the right direction, OEE ceases to be just another KPI on a report. It becomes the “core engine” that sustainably reduces waste, boosts productivity, and maximizes profitability using your existing resources.
Ultimately, the most successful manufacturing plants are not necessarily those with the most expensive machinery, but those that leverage their data most effectively and translate it into continuous improvement. This is the pivotal role that OEE coupled with Solwer Solutions plays in laying a solid foundation for long-term, sustainable factory development.
Downloading the Solwer e-book will empower you to go beyond the theoretical concepts of OEE. It will guide you in practically applying these principles to your actual shop floor environment, providing step-by-step problem-solving examples, and helping you build a strategic roadmap for sustainable equipment optimization.
into Productivity
industrial experts.